
Buildings are living things. Buildings change shape every day and every minute. They are used by plenty of people, endlessly. Buildings shape our context and environment, and they impact our well-being to a large extent. Buildings constantly change their behavior under the influence of external conditions and occupants. We have an interest in engineering these buildings and making them as comfortable and pleasant as possible. Instead of treating buildings as static monuments that happen to be in our environment, it makes sense to treat them as living things that change incessantly, with streams of people, streams of materials and goods, and as ever-changing ecosystems of living beings.
And so, we must engineer the knowledge and information of our buildings! We need to provide our buildings with a set of brains, brains that evolve and continuously track the state of the facility and all of its internals: systems, materials, demountable elements, furniture, and people. The brains hold a snapshot of the building at any moment and allow us to ensure that this living building responds in a useful and likable manner (comfort). And this needs efforts from us human beings, and not only from ‘the AI.’
To learn more about knowledge graphs for buildings, please refer to the chapter “Knowledge Graphs and Linked Data for the Built Environment” by the author and co-authors Aaron Costin and Mads Holten Rasmussen as part of a Springer book Industry 4.0 for the Built Environment, edited by Marzia Bolpagni, Rui Gavina, and Diogo Rodrigo Ribeiro.
What knowledge is in a knowledge graph for buildings
Knowledge graphs are networks of data that capture the ‘knowledge’ of any object or concept at any particular moment in time – and so it becomes a snapshot representation or ‘semi-brain’ of that object. So what if we engineer our buildings, and a ‘knowledge graph’ or ‘semi-brain’ would be available for each and every building? The technology is ready. Knowledge graphs are webs of data that represent the tangible and intangible elements in a building. They are structured representations of buildings that capture the state of the facility at any moment in time. This knowledge graph evolves, grows, and shrinks with the building life cycle. And so, it is possible to engineer each of our buildings as a cyber-physical system with the knowledge graph functioning as its brain.
The knowledge graph originates from 2001 and Sir Tim Berners-Lee, the inventor of the World Wide Web [1]. It allows us to describe information and data on an international world wide web-scale, yet interpretable by machines. The denominated standardized language for creating such knowledge graphs is the Resource Description Framework (RDF), supported by the Web Ontology Language (OWL) that can be used to describe vocabularies.
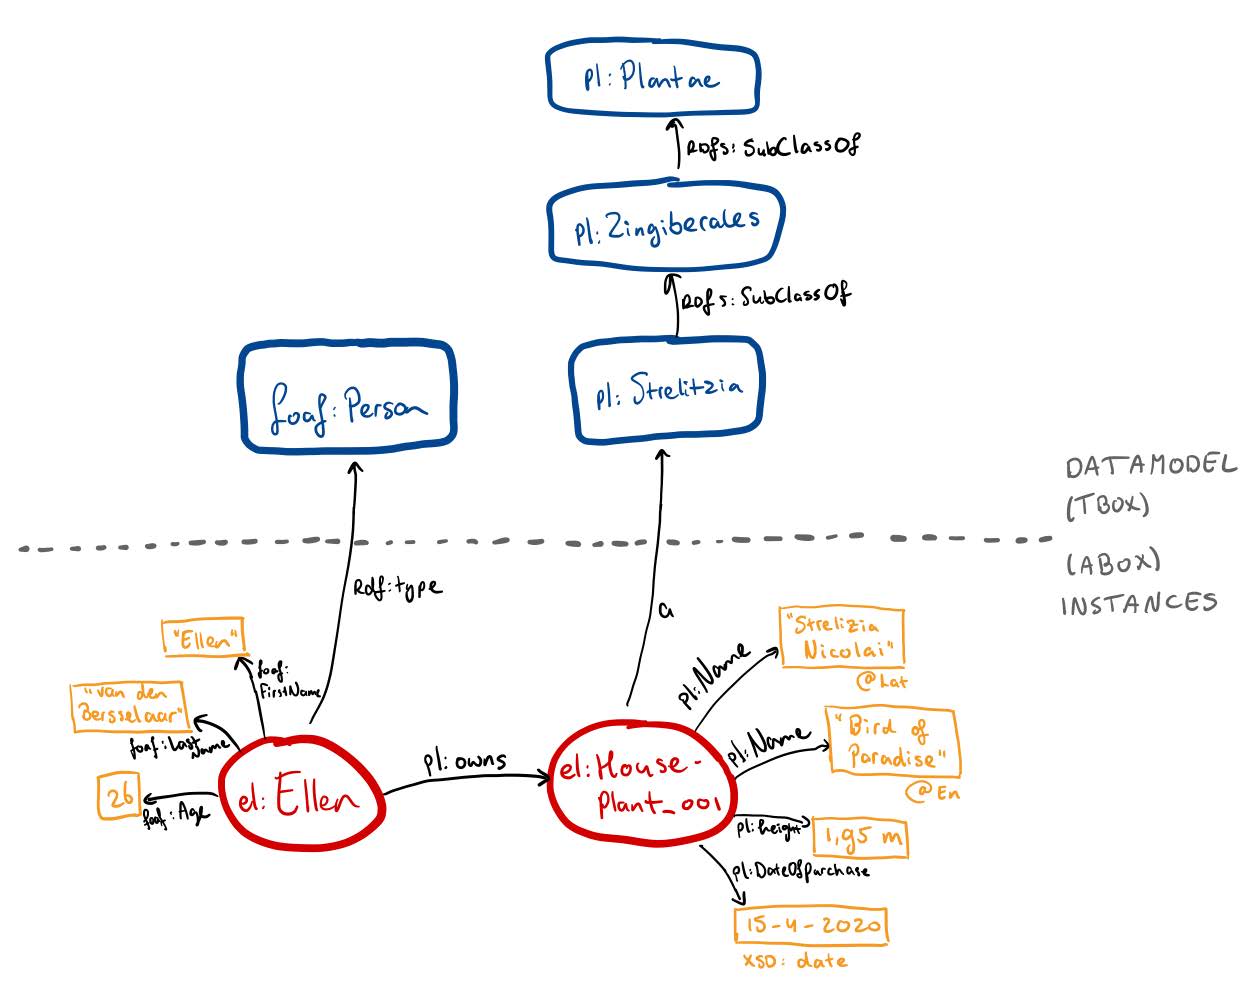
A long list of strong and well-structured vocabularies is currently available for representing building data, and they are commonly known as the Linked Building Data (LBD) ontologies or vocabularies [2,3]. They allow the representation of building data as graphs (networks or webs), in full structured detail, including geometry, object classification, properties, product data, geospatial data, building topology, telemetry, damage and asset maintenance data, and so forth [4]. As these are openly available in a web-friendly format, it is easy to generate a knowledge graph per building that provides the latest and previous states of a building in its lifetime and life cycle. These can serve as digital twins or digital logbooks of these buildings, with passports or blueprints of their internal states. The data can be used to enhance the quality of life inside these buildings, for asset management and maintenance, to support renovation projects, and so forth.
A decentralized planet with freedom of data
These knowledge graphs are engineered by humans, leading to high-quality content. They are ideally not auto-generated by any machine learning algorithms that would make the content less trustworthy, of lower quality, and less explainable. For the sake of our buildings and our role as inhabitants of this space, humans must invest time and effort in engineering their building data.
In that case, the future holds a network of access points for high-quality building data that can be used to provide high-end services. Each building has a unique identifier that takes the form of Uniform Resource Identifiers (URIs or web addresses). It becomes the building owner’s responsibility to expose the building data at this access point and state under which conditions such data may be used.
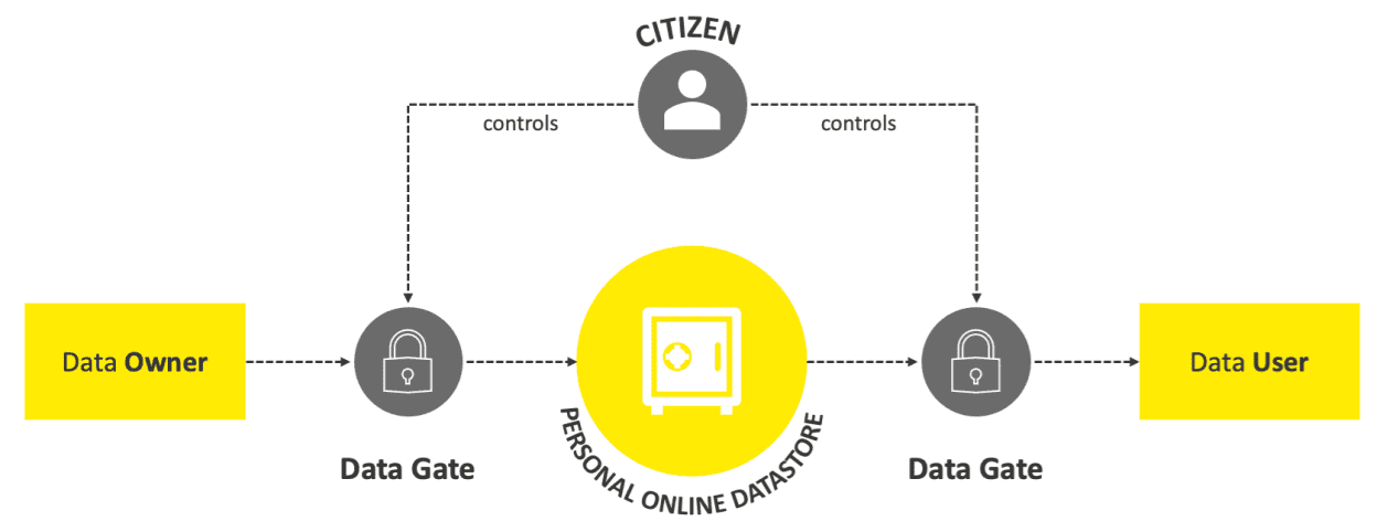
In such future, data is available ‘as a commodity’, which is pioneered in Flanders, Belgium [5]. Similar to how citizens are expected to have a ‘right for access’ to water, electricity, gas, and transportation networks, they are also expected to have a right to personal data as part of a national data infrastructure. Data then becomes a commodity, with every citizen having the right to and responsibility over their own data.
A rich world of multicolored viewpoints and perspectives in data
In this future world, there is ‘freedom of data’, enabled through large-scale federated system architecture, and URIs and knowledge graphs as signposts and gateways on this digital network infrastructure. At its very core, this freedom of data and data as a commodity is built on a horizontal and decentralized perception of the world, in which there is room for ‘Multiple Sources of Truth’ (MSOT) instead of the more centralized ‘Single Source of Truth’ (SSOT). It is essential and crucial that multiple viewpoints and perspectives on data are supported, as these are the hallmark of richness and wealth and diversity that characterizes human civilization, and it is our strength.
Each perspective and viewpoint of a building materialized in a knowledge graph or ‘brain of the building’ relies on its own vocabularies. Those vocabularies can be cherry-picked from a large set of Linked Building Data (LBD) vocabularies that are built bottom-up in a modular and scalable fashion and contain a good level of standardization and agreement [2,3]. While these vocabularies still change, similar to how any modern language (e.g., English, Spanish, Dutch) still changes gradually over time, they provide a base set of understandable and usable languages across organisations and individuals (is this interoperability?).
By openly using such languages and embracing our human ability to build Babylonian towers without a ‘single-language standard’, we create a rich world of linked building data that can be browsed and surfed, and used as needed – taking into account ethical use and privacy permissions. Such a networked world of knowledge graphs for buildings, including Multiple Sources of Truth (MSOT), encourages people to invest time and effort to have dialogues, to try to understand each other’s content, and to value its content – interoperability achieved through human effort and interpretation.
Further Resources and Reading
- Tim Berners-Lee, James Hendler and Ora Lassila, The Semantic Web, Scientific American 284:5, 2001.https://www.scientificamerican.com/article/the-semantic-web/
- Pauwels, P., & McGlinn, K. (Eds.) (2022). Buildings and Semantics: Data Models and Web Technologies for the Built Environment. CRC Press. https://doi.org/10.1201/9781003204381
- World Wide Web Consortium, Linked Building Data Community Group. https://www.w3.org/community/lbd/
- Gabe Fierro and Pieter Pauwels. Survey of metadata schemas for data-driven smart buildings. Report for IEA Annex 81. EBC Energy in Building and Communities Programme, June 2022. https://annex81.iea-ebc.org/publications/
- Digital Flanders. The Flemish Data Utility Company. https://www.vlaanderen.be/digitaal-vlaanderen/het-vlaams-datanutsbedrijf/the-flemish-data-utility-company
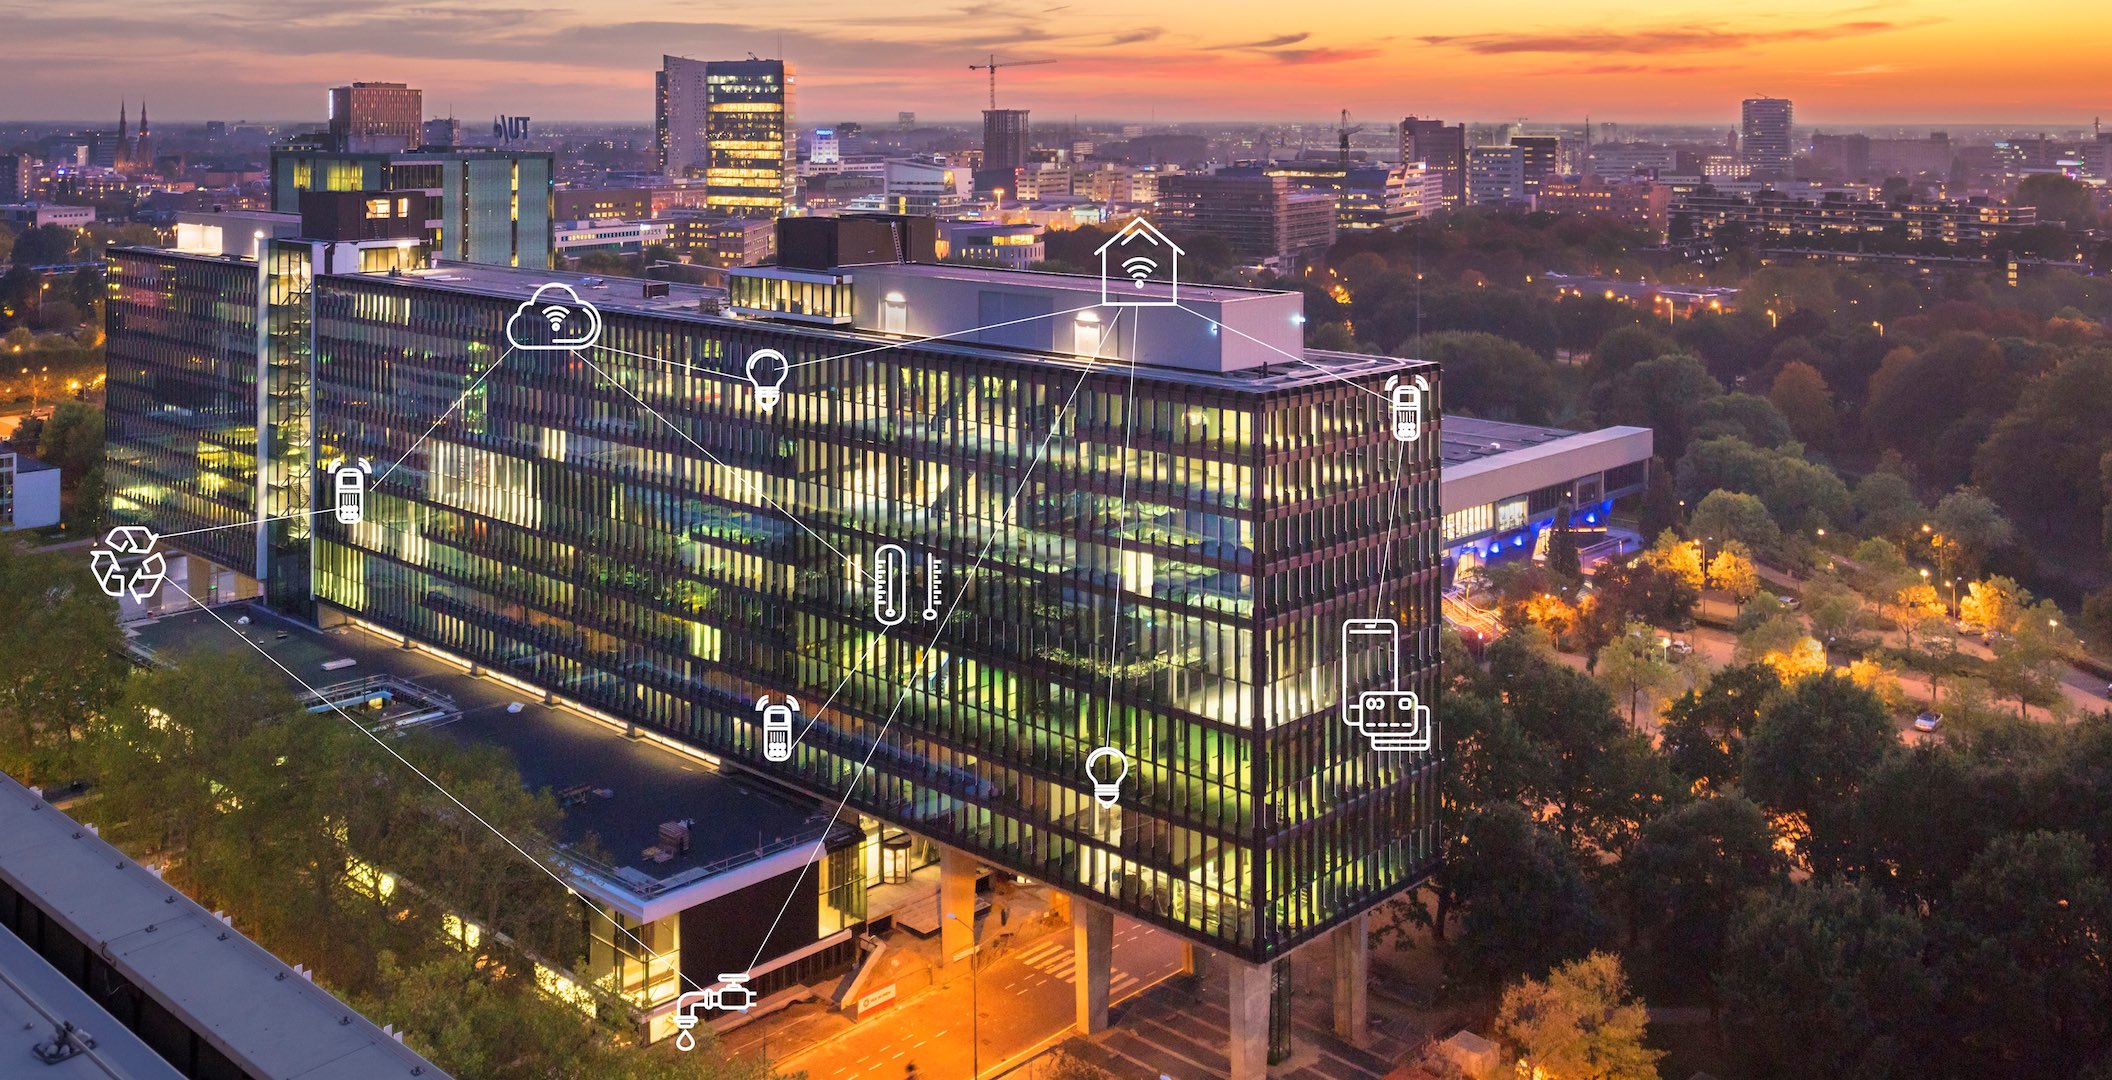
Image 1: Atlas building, TU Eindhoven, Netherlands.
About the author

View the original article and our Inspiration here
Leave a Reply